

You know your zones. Five, six or seven depending on the app, written in watts, with clean edges down to the watt. You build your week on them.
They come from a percentage applied to a single number. And that number matches no boundary in your body.
What you were sold
The table you use comes from Coggan, and it did the sport an enormous service. Seven levels, each one a percentage of your FTP, each one with a purpose. Recovery under 55 %, endurance from 56 to 75 %, tempo up to 90 %, threshold around 100 %, VO2max above.
It is credible because it is coherent, simple, and it works for talking to each other. Say “ride Z2” and it lands in one second. No other convention has done better.
The slip happened somewhere else. We stopped reading it as a language convention and started reading it as physiology.
The only two boundaries your body knows
Your body cannot tell 74 % from 76 % of your FTP. What it can tell apart is three operating regimes, separated by two boundaries.
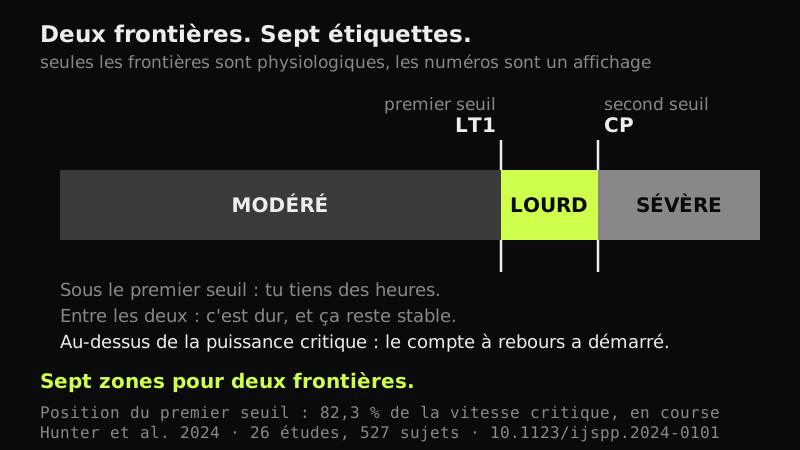
Below the first threshold, your lactate stays low and steady. You can hold it for hours. That is the moderate domain.
Between the first threshold and critical power, your lactate climbs, then settles at a high level. It is hard, it is stationary, and it has an end you can put a number on. That is the heavy domain.
Above critical power, nothing settles. Your lactate rises until you stop, your oxygen uptake drifts up towards its maximum, and the only variable left is how much time you have. That is the severe domain.
Those two boundaries are physiological objects. They exist whether you measure them or not, and they owe nothing to any table.
What the measurement says
Here is the problem. We know these boundaries exist. We do not know how to measure them reproducibly.
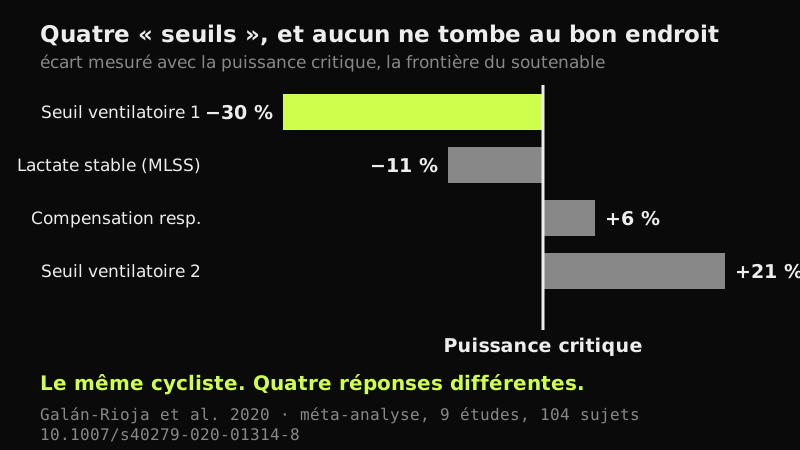
Galán-Rioja and colleagues published a systematic review with meta-analysis in Sports Medicine in 2020 on exactly that question: how close to each other do the markers we use to locate the upper boundary actually land? Nine studies, 104 participants, four markers put up against critical power.
The correlations are good. The pooled coefficient is 0.73, and it rises to 0.80 for the respiratory compensation point. On paper, everyone is measuring the same thing.
Except the values do not land in the same place. The first ventilatory threshold underestimates critical power by 30 %. Maximal lactate steady state underestimates it by 11 %. The respiratory compensation point overestimates it by 6 %, and the second ventilatory threshold by 21 %. That last one is not correlated with critical power at all: 0.39, with a p value of 0.31.
The authors’ conclusion is blunt. If critical power really marks the transition from heavy to severe, none of the other markers can stand in for it.
And on the one pair that should work
You would hope the two closest markers, critical power and maximal lactate steady state, are interchangeable. Micheli and his team looked at that in 2025 in PeerJ, across ten studies kept out of 782.
The mean gap is 12.4 W. Small, and misleading, because the limits of agreement run from minus 19 W to plus 44 W. On a given rider, one of the two can land 19 W under the other or 44 W over it. The authors write that this between-individual variability compromises their interchangeability.
Borszcz and colleagues shut the door in 2024 in the Journal of Strength and Conditioning Research, with a Bayesian meta-regression over 36 studies. Their result is the most uncomfortable of the lot: the gap between the two depends on the protocol you picked. Stage duration, the lactate rise criterion, the number of rest breaks, the length of the longest effort used for the model, the mathematical model itself. Change one of those settings and you change the answer.
What this changes in your week
Take your Zone 2, the one that runs up to 75 % of your FTP.
That upper edge is a percentage. Your first threshold is a physiological point that belongs to you. Nothing guarantees they coincide, and there are good reasons to think they do not: measured in real subjects, the first threshold can sit at 23 % of peak power in one rider and 57 % in another.
If your real first threshold sits below the top of your Zone 2, then the upper half of your “easy” rides happens in the heavy domain. You accumulate fatigue like tempo and you believe you are doing endurance. That is exactly how junk miles are made, and it is invisible from your screen, because your screen says “Z2” with total confidence.
How you test your two boundaries
The upper boundary you can get close to. A well-run test effort gives you a usable estimate, and that is the subject of another article.
The lower boundary is the real problem, because it decides your entire volume, and nobody tests it.
Lactate. The direct measurement, around 2 mmol/L. It takes a meter and strips, and it stays the field reference.
The talk test. It looks crude. It is not. Woltmann and colleagues, in 2015 in the Journal of Strength and Conditioning Research, show it is enough to regulate the intensity of a session. Rodríguez-Marroyo and his team measured it in 2013 in well-trained cyclists and place it in line with the ventilatory thresholds. Quinn and Coons find the same relationship in 2011 in the Journal of Sports Sciences. These are small samples, and they suggest a correspondence rather than prove one. That is already a lot for a free tool. If you cannot finish a full sentence, you have crossed the boundary.
Estimating down from the top. Hunter and colleagues pooled 26 studies and 527 participants in 2024, in the International Journal of Sports Physiology and Performance, to place the first threshold relative to critical speed in running. It lands at 82.3 %, with a confidence interval of 81.1 to 83.6. The number rises with level: 80.6 % in the slower runners, 84.2 % in the faster ones. That is a starting point, not your measurement.
Heart rate variability. Kaufmann and colleagues reviewed 27 studies and 461 participants in 2023 in Sports Medicine Open on thresholds derived from heart rate variability. For the lower boundary, the bias against the ventilatory threshold is 1 bpm, which is excellent, but the limits of agreement spread from minus 10.9 to plus 12.8 bpm. The authors call it a promising approach for the lower boundary, and ask for more work on the upper one.
What still holds
Be honest about what this article does not say.
The correlations are real and they are strong. Between 0.73 and 0.80, those are not accidents. Your zone table gives you a good order of magnitude, and an order of magnitude is worth far more than riding on feel.
And as a shared language, it has no replacement. A plan has to be able to write you an instruction you understand without a lactate meter.
The table is not the problem. Believing it measures something, when all it does is name something, is.
The Cornerman verdict
A zone is not a physiological object. It is a label stuck on a continuum, and where the label sits depends on the method that stuck it there.
What counts is the domain you are riding in and where you sit inside it. The number is display. We use it to talk, never as an anchor. That is our call, and we would rather tell you.
So stop arguing about the third decimal of your Zone 2. Go and find where your first threshold falls. It is the one boundary of the two that nobody tests, and it decides the colour of every easy hour you ride.
What we don’t know
No valid conversion exists between a zone table and one individual’s boundaries. We know the markers diverge. We do not know by how much in you.
The keystone meta-analysis rests on 104 participants. That is thin for a result this structural, and the studies it includes use heterogeneous protocols, which is precisely the problem they describe.
The 82.3 % ratio between first threshold and critical speed is measured in running. The cycling equivalent, at the same level of evidence, does not exist. The authors themselves flag uncertainty tied to how both boundaries were determined.
Nobody knows why the second ventilatory threshold is not correlated with critical power when the other three markers are. The result is there. The explanation is not.
Sources
- Galán-Rioja MÁ, González-Mohíno F, Poole DC, González-Ravé JM (2020). Relative Proximity of Critical Power and Metabolic/Ventilatory Thresholds: Systematic Review and Meta-Analysis · Sports Medicine ·
10.1007/s40279-020-01314-8· systematic review and meta-analysis, 9 studies, 104 participants. - Micheli L, Lucertini F, Grossi T, Pogliaghi S, Keir DA, Ferri Marini C (2025). Analysis of the factors influencing the proximity and agreement between critical power and maximal lactate steady state: a systematic review and meta-analyses · PeerJ ·
10.7717/peerj.19060· systematic review and meta-analyses, 10 studies kept out of 782. - Borszcz FK, de Aguiar RA, Costa VP, Denadai BS, de Lucas RD (2024). Agreement Between Maximal Lactate Steady State and Critical Power in Different Sports: A Systematic Review and Bayesian’s Meta-Regression · Journal of Strength and Conditioning Research ·
10.1519/jsc.0000000000004772· systematic review and Bayesian meta-regression, 36 studies. - Hunter B, Meyler S, Maunder E, Cox TH, Muniz-Pumares D (2024). The Relationship Between the Moderate-Heavy Boundary and Critical Speed in Running · International Journal of Sports Physiology and Performance ·
10.1123/ijspp.2024-0101· systematic review, 26 studies, 527 participants. - Kaufmann S, Gronwald T, Herold F, Hoos O (2023). Heart Rate Variability-Derived Thresholds for Exercise Intensity Prescription in Endurance Sports: A Systematic Review of Interrelations and Agreement with Different Ventilatory and Blood Lactate Thresholds · Sports Medicine Open ·
10.1186/s40798-023-00607-2· systematic review, 27 studies, 461 participants. - Woltmann ML, Foster C, Porcari JP, Camic CL, Dodge C, Haible S, Mikat RP (2015). Evidence that the talk test can be used to regulate exercise intensity · Journal of Strength and Conditioning Research ·
10.1519/jsc.0000000000000811. - Rodríguez-Marroyo JA, Villa JG, García-López J, Foster C (2013). Relationship between the talk test and ventilatory thresholds in well-trained cyclists · Journal of Strength and Conditioning Research ·
10.1519/jsc.0b013e3182736af3. - Quinn TJ, Coons BA (2011). The Talk Test and its relationship with the ventilatory and lactate thresholds · Journal of Sports Sciences ·
10.1080/02640414.2011.585165.